目次
・Robynとは
・とりあえずチュートリアルやってみる
・向き合い方
・参考情報
Robynとは
Robyn(ロビン)はFacebook(META)が開発しているMarketing-Mix-Modeling(以降、MMM)のオープンソース(https://facebookexperimental.github.io/Robyn/)です。主にR言語で開発されています。(Python版は目下開発中らしいです。)
MMMは、マーケティングの広告投資の予算を、効果を最大化するためにどこに配分するかを数理的なモデルで決めようとするものです。
そもそも、MMMにそれほど明るくない方もおられると思いますが、その際は、『データ活用のための数理モデリング入門』の100ページ目に目的やら簡単な概要が載っていますので、参考にされると良いと思います。
また、RobynにはRobyn Open Source MMM Usersというユーザーグループがあるようです。そこそこ活発に運営されているようです。
私は以前、このコミュニティーのイベント(Facebook Project Robyn Open Source MMM 2021 Community Summit)があったので聴講しました。英語が苦手なので何度も聞きなおしましたが。。
この会では、世界中のマーケターがRobynを使ってプロモーションの分析をしているのを知れました。彼らはRobynのアーリーアダプターなんだろうなと思いました。
とりあえずチュートリアルやってみる
とりあえず、Robynがどういうツールなのか知るためにチュートリアル(https://facebookexperimental.github.io/Robyn/docs/quick-start/)をやってみることにしました。
まずは、Rを最新版にします。今回は「R version 4.2.0 (2022-04-22) — “Vigorous Calisthenics”」にしました。
|
1 2 |
# package install install.packages("Robyn") |
結構な数の依存パッケージがインストールされているようです。スクロールバーがめちゃ小さくなりました。時間もそれなりにかかるようです。
|
1 2 3 4 5 6 |
## RobynではPythonのライブラリを使う install.packages("reticulate") library(reticulate) virtualenv_create("r-reticulate") py_install("nevergrad", pip = TRUE) use_virtualenv("r-reticulate", required = TRUE) |
Robynパッケージを読み込み、サンプルデータを呼び出します。
|
1 2 3 4 5 6 7 |
library(Robyn) data("dt_simulated_weekly") head(dt_simulated_weekly) data("dt_prophet_holidays") head(dt_prophet_holidays) |
モデルを作る際の入力変数の設定をします。途中でProphetが使われているようです。確かに、Prophetは時系列の分析にちょうど適したライブラリではあります。
さて、指定する入力変数は結構多くて、以下の通りです。
・データセット
・従属変数
・従属変数のタイプ
・Prophetでの周期性などのオプション
・国
・競合の情報やイベントなどのコンテキスト変数
・ペイドメディアの支出
・ペイドメディアのインプレッションやクリックなど
・オーガニックな変数
・コンテキスト変数のなかでオーガニックなもの
・期初、期末
・広告の残存効果
実務でMMMを使っているものからすると馴染み深いですので、「ああ、このデータですね」とスッと頭に入ってきます。コードでいろいろ個別にやるととっ散らかるので、こういうカタマリで処理を実行できるのはいいですね。MMMが初めての方は、扱うデータセットの概要をよく調べてから入力変数にするようにしたほうがいいと思います。
|
1 2 3 4 5 6 7 8 9 10 11 12 13 14 15 16 17 18 19 20 21 22 23 |
## 入力変数の設定 InputCollect <- robyn_inputs( dt_input = dt_simulated_weekly , dt_holidays = dt_prophet_holidays , date_var = "DATE" # "2020-01-01"みたいにする , dep_var = "revenue" # 従属変数 , dep_var_type = "revenue" # "revenue" (ROI) or "conversion" (CPA) , prophet_vars = c("trend", "season", "holiday") # "trend","season", "weekday" & "holiday" , prophet_country = "DE" # input one country. dt_prophet_holidays includes 59 countries by default , context_vars = c("competitor_sales_B", "events") # e.g. competitors, discount, unemployment etc , paid_media_spends = c("tv_S","ooh_S", "print_S" ,"facebook_S", "search_S") # mandatory input , paid_media_vars = c("tv_S", "ooh_S" , "print_S" ,"facebook_I" ,"search_clicks_P") # mandatory. # paid_media_vars must have same order as paid_media_spends. Use media exposure metrics like # impressions, GRP etc. If not applicable, use spend instead. , organic_vars = c("newsletter") # marketing activity without media spend , factor_vars = c("events") # specify which variables in context_vars or organic_vars are factorial , window_start = "2016-11-23" , window_end = "2018-08-22" , adstock = "geometric" # geometric, weibull_cdf or weibull_pdf. ) print(InputCollect) |
次に、ハイパーパラメータの設定を行います。『StanとRでベイズ統計モデリング (Wonderful R)』の作法に従うならば、あまりハイパーパラメータを恣意的に決めて収束させるのはやりたくないですが、明らかに符号がおかしいとかの制約は付けてもいいのかなと思います。
|
1 2 3 4 5 6 7 8 9 10 11 12 13 14 15 16 17 18 19 20 21 22 23 24 25 26 27 28 |
## ハイパーパラメータの設定 hyper_names(adstock = InputCollect$adstock, all_media = InputCollect$all_media) hyperparameters <- list( facebook_S_alphas = c(0.5, 3) ,facebook_S_gammas = c(0.3, 1) ,facebook_S_thetas = c(0, 0.3) ,print_S_alphas = c(0.5, 3) ,print_S_gammas = c(0.3, 1) ,print_S_thetas = c(0.1, 0.4) ,tv_S_alphas = c(0.5, 3) ,tv_S_gammas = c(0.3, 1) ,tv_S_thetas = c(0.3, 0.8) ,search_S_alphas = c(0.5, 3) ,search_S_gammas = c(0.3, 1) ,search_S_thetas = c(0, 0.3) ,ooh_S_alphas = c(0.5, 3) ,ooh_S_gammas = c(0.3, 1) ,ooh_S_thetas = c(0.1, 0.4) ,newsletter_alphas = c(0.5, 3) ,newsletter_gammas = c(0.3, 1) ,newsletter_thetas = c(0.1, 0.4) ) |
ハイパーパラメータを設定したら、アルゴリズムを実行します。裏側でベイズ推定をしていることから、結構時間がかかります。Prophetを動かすということはStanを動かしていることと同義ですから。
|
1 2 3 4 5 6 7 8 9 10 11 12 13 |
InputCollect <- robyn_inputs(InputCollect = InputCollect, hyperparameters = hyperparameters) print(InputCollect) ## Run all trials and iterations. Use ?robyn_run to check parameter definition OutputModels <- robyn_run( InputCollect = InputCollect # feed in all model specification #, cores = NULL # default #, add_penalty_factor = FALSE # Untested feature. Use with caution. , iterations = 2000 # recommended for the dummy dataset , trials = 5 # recommended for the dummy dataset , outputs = FALSE # outputs = FALSE disables direct model output ) print(OutputModels) |
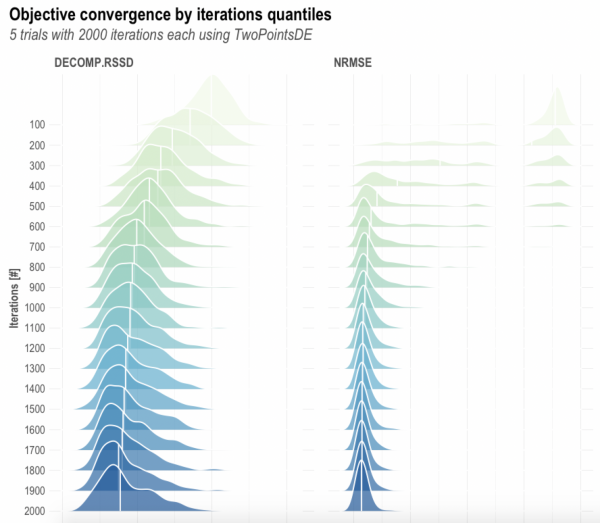
イタレーションごとのモデルの目的関数の事後分布を可視化します。徐々に収束してそうに見えます。
|
1 2 |
## Check MOO (multi-objective optimization) convergence plots OutputModels$convergence$moo_distrb_plot |
|
1 |
OutputModels$convergence$moo_cloud_plot |
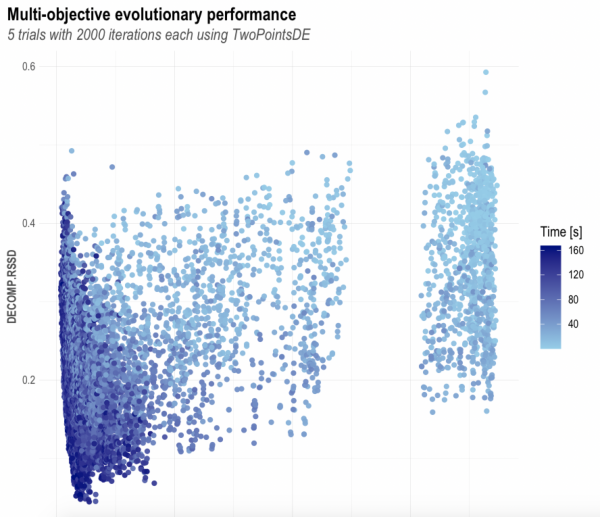
モデルがいろいろと求まったので、パレート最適な組み合わせの計算をします。
|
1 2 3 4 5 6 7 8 9 10 11 |
## Calculate Pareto optimality, cluster and export results and plots. See ?robyn_outputs OutputCollect <- robyn_outputs( InputCollect, OutputModels , pareto_fronts = 3 # , calibration_constraint = 0.1 # range c(0.01, 0.1) & default at 0.1 , csv_out = "pareto" # "pareto" or "all" , clusters = TRUE # Set to TRUE to cluster similar models by ROAS. See ?robyn_clusters , plot_pareto = TRUE # Set to FALSE to deactivate plotting and saving model one-pagers , plot_folder = robyn_object # path for plots export ) print(OutputCollect) |
パレート最適な組み合わせで返された複数のモデルから一つを選びます。
|
1 2 3 4 5 6 7 8 9 |
print(OutputCollect) select_model <- "1_143_4" # select one from above ExportedModel <- robyn_save( robyn_object = robyn_object # model object location and name , select_model = select_model # selected model ID , InputCollect = InputCollect , OutputCollect = OutputCollect ) print(ExportedModel) |
選んだモデルの係数などを確認します。
|
1 2 3 4 5 6 7 8 9 10 11 12 13 14 15 16 17 |
> print(ExportedModel) Exported file: MyRobyn.RDS Exported model: 1_143_4 Media Summary for Selected Model: rn coef mean_spend mean_response roi_mean total_spend total_response 1: facebook_S 23432.93 136111.15 11556.96 0.08490823 5988890 594478.3 2: ooh_S 237278.85 262577.85 90572.07 0.34493417 10240536 5956088.7 3: print_S 450597.23 77589.33 79774.15 1.02815874 2793216 3123007.2 4: search_S 185857.45 47618.18 28802.09 0.60485482 3666600 2440274.7 5: tv_S 551227.13 256198.38 110879.89 0.43278921 10247935 5859543.8 roi_total 1: 0.09926351 2: 0.58161884 3: 1.11806864 4: 0.66554157 5: 0.57177799 |
この選んだモデルをもとに、最適なアロケーションを計算します。
|
1 2 3 4 5 6 7 8 9 10 11 12 13 14 |
# Run the "max_historical_response" scenario: "What's the revenue lift potential with the # same historical spend level and what is the spend mix?" AllocatorCollect1 <- robyn_allocator( InputCollect = InputCollect , OutputCollect = OutputCollect , select_model = select_model , scenario = "max_historical_response" , channel_constr_low = 0.7 , channel_constr_up = c(1.2, 1.5, 1.5, 1.5, 1.5) , export = TRUE , date_min = "2016-11-21" , date_max = "2018-08-20" ) print(AllocatorCollect1) |
推定した、選んだモデルでの最適な広告のアロケーション結果を出力します。予算を削った方がいい広告経路、増やした方がいい広告経路などが示されます。
|
1 2 3 4 5 6 7 8 9 10 11 12 13 14 15 16 17 18 19 20 21 22 23 24 25 26 27 28 29 30 31 32 33 34 35 36 37 38 39 |
> print(AllocatorCollect1) Model ID: 1_143_4 Scenario: Maximum Historical Response Media Skipped (coef = 0): None Relative Spend Increase: 0% (+0) Total Response Increase (Optimized): 31.2% Window: 2016-11-21:2018-08-20 (92 weeks) Allocation Summary: - facebook_S: Optimizable Range (bounds): [-30%, 50%] Mean Spend Share (avg): 17.4% -> Optimized = 12.2% Mean Response: 11,557 -> Optimized = 8,016 Mean Spend (per time unit): 136.1K -> Optimized = 95.28K [Delta = -30%] - ooh_S: Optimizable Range (bounds): [-30%, 50%] Mean Spend Share (avg): 33.7% -> Optimized = 24.3% Mean Response: 90,572 -> Optimized = 80,605 Mean Spend (per time unit): 262.6K -> Optimized = 189.6K [Delta = -28%] - print_S: Optimizable Range (bounds): [-30%, 50%] Mean Spend Share (avg): 9.95% -> Optimized = 14.9% Mean Response: 79,774 -> Optimized = 140,513 Mean Spend (per time unit): 77.59K -> Optimized = 116.4K [Delta = 50%] - search_S: Optimizable Range (bounds): [-30%, 50%] Mean Spend Share (avg): 6.1% -> Optimized = 9.16% Mean Response: 28,802 -> Optimized = 57,873 Mean Spend (per time unit): 47.62K -> Optimized = 71.43K [Delta = 50%] - tv_S: Optimizable Range (bounds): [-30%, 20%] Mean Spend Share (avg): 32.8% -> Optimized = 39.4% Mean Response: 110,880 -> Optimized = 134,921 Mean Spend (per time unit): 256.2K -> Optimized = 307.4K [Delta = 20%] |
続いて、支出の上限を決めた上での、7日間でのアロケーションを行います。
|
1 2 3 4 5 6 7 8 9 10 11 |
AllocatorCollect2 <- robyn_allocator( InputCollect = InputCollect , OutputCollect = OutputCollect , select_model = select_model , scenario = "max_response_expected_spend" , channel_constr_low = c(0.7, 0.7, 0.7, 0.7, 0.7) , channel_constr_up = c(1.2, 1.5, 1.5, 1.5, 1.5) , expected_spend = 1000000 # Total spend to be simulated , expected_spend_days = 7 # Duration of expected_spend in days , export = TRUE ) |
こちらが、出力した結果です。
|
1 2 3 4 5 6 7 8 9 10 11 12 13 14 15 16 17 18 19 20 21 22 23 24 25 26 27 28 29 30 31 32 33 34 35 36 37 38 39 |
> print(AllocatorCollect2) Model ID: 1_143_4 Scenario: Maximum Response with Expected Spend Media Skipped (coef = 0): None Relative Spend Increase: 28.2% (+1.1M in 7 days) Total Response Increase (Optimized): 38.8% Window: 2016-11-21:2018-08-20 (92 weeks) Allocation Summary: - facebook_S: Optimizable Range (bounds): [-30%, 50%] Mean Spend Share (avg): 17.4% -> Optimized = 12% Mean Response: 11,557 -> Optimized = 10,238 Mean Spend (per time unit): 136.1K -> Optimized = 119.7K [Delta = -12%] - ooh_S: Optimizable Range (bounds): [-30%, 50%] Mean Spend Share (avg): 33.7% -> Optimized = 38.5% Mean Response: 90,572 -> Optimized = 102,837 Mean Spend (per time unit): 262.6K -> Optimized = 385.1K [Delta = 47%] - print_S: Optimizable Range (bounds): [-30%, 50%] Mean Spend Share (avg): 9.95% -> Optimized = 11.6% Mean Response: 79,774 -> Optimized = 140,513 Mean Spend (per time unit): 77.59K -> Optimized = 116.4K [Delta = 50%] - search_S: Optimizable Range (bounds): [-30%, 50%] Mean Spend Share (avg): 6.1% -> Optimized = 7.14% Mean Response: 28,802 -> Optimized = 57,873 Mean Spend (per time unit): 47.62K -> Optimized = 71.43K [Delta = 50%] - tv_S: Optimizable Range (bounds): [-30%, 20%] Mean Spend Share (avg): 32.8% -> Optimized = 30.7% Mean Response: 110,880 -> Optimized = 134,921 Mean Spend (per time unit): 256.2K -> Optimized = 307.4K [Delta = 20%] |
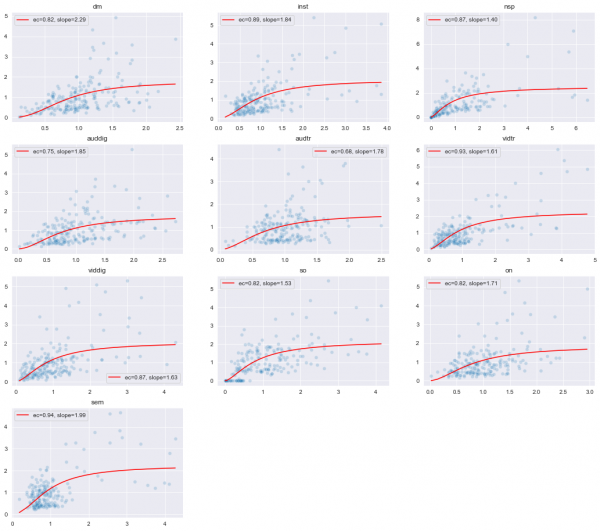
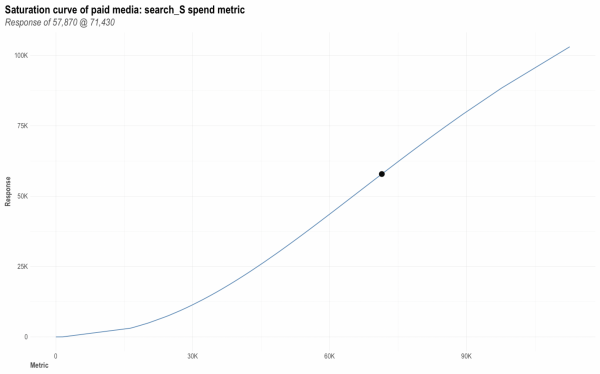
続いて、特定の広告経路の目的関数に対しての影響度が支出に応じてどう変わっていくか、つまりサチっているかどうかを見てみます。
|
1 2 3 4 5 6 7 8 9 10 11 12 13 14 15 16 17 18 19 20 21 22 23 |
## QA optimal response # Pick any media variable: InputCollect$all_media select_media <- "search_S" # For paid_media_spends set metric_value as your optimal spend metric_value <- AllocatorCollect1$dt_optimOut[channels == select_media, optmSpendUnit] # # For paid_media_vars and organic_vars, manually pick a value # metric_value <- 10000 if (TRUE) { optimal_response_allocator <- AllocatorCollect1$dt_optimOut[ channels == select_media, optmResponseUnit] optimal_response <- robyn_response( robyn_object = robyn_object, select_build = 0, media_metric = select_media, metric_value = metric_value) plot(optimal_response$plot) if (length(optimal_response_allocator) > 0) { cat("QA if results from robyn_allocator and robyn_response agree: ") cat(round(optimal_response_allocator) == round(optimal_response$response), "( ") cat(optimal_response$response, "==", optimal_response_allocator, ")\n") } } |
支出に関して、目的関数がサチっているかどうかを見てみます。
新しいデータで、現在のモデルをアップデートします。
|
1 2 3 4 5 6 7 8 9 10 11 12 13 14 15 16 17 18 19 20 21 |
# Run ?robyn_refresh to check parameter definition Robyn <- robyn_refresh( robyn_object = robyn_object , dt_input = dt_simulated_weekly , dt_holidays = dt_prophet_holidays , refresh_steps = 1 , refresh_mode = "manual" , refresh_iters = 1000 # 1k is estimation. Use refresh_mode = "manual" to try out. , refresh_trials = 3 , clusters = FALSE ) # Export this refreshed model you wish to export last_refresh_num <- sum(grepl('listRefresh', names(Robyn))) + 1 # Pick any refresh. # Here's the final refresh using the model recommended by least combined normalized nrmse and decomp.rssd ExportedRefreshModel <- robyn_save( robyn_object = robyn_object , select_model = Robyn[[last_refresh_num]]$OutputCollect$selectID , InputCollect = Robyn[[last_refresh_num]]$InputCollect , OutputCollect = Robyn[[last_refresh_num]]$OutputCollect ) |
アップデートした場合、先ほどと同様に、推定結果や予算に応じたアロケーションを出力します。
|
1 2 3 4 5 6 7 8 9 10 11 12 13 14 15 16 17 18 19 20 21 |
# Run ?robyn_allocator to check parameter definition AllocatorCollect <- robyn_allocator( robyn_object = robyn_object #, select_build = 1 # Use third refresh model , scenario = "max_response_expected_spend" , channel_constr_low = c(0.7, 0.7, 0.7, 0.7, 0.7) , channel_constr_up = c(1.2, 1.5, 1.5, 1.5, 1.5) , expected_spend = 2000000 # Total spend to be simulated , expected_spend_days = 14 # Duration of expected_spend in days ) print(AllocatorCollect) # Get response for 80k from result saved in robyn_object Spend1 <- 60000 Response1 <- robyn_response( robyn_object = robyn_object #, select_build = 1 # 2 means the second refresh model. 0 means the initial model , media_metric = "search_S" , metric_value = Spend1) Response1$response/Spend1 # ROI for search 80k Response1$plot |
向き合い方
以上、チュートリアルを行いましたが、過去にMMMを実務で使ったことがあるものとしては、Robynはかなりオートマチックなツールだなぁと思いました。時系列のベイズモデリングに対してProhpetに感じた感情と似ているかもしれません。
パレート最適なものを見つけたり、アロケーションをどうするかを決めたりする関数までもが用意されており、適切にモデルを作成することさえできれば、データサイエンティストの業務時間をかなり削減することができると思います。
ただ、残存効果をカスタマイズしたり、独自のモデルをやる自由度はある程度犠牲にしていると思うので、当てはまりにこだわる場合、これまで通りStanなどで独自にアルゴリズムを書くこともあってしかるべきかなと思います。
参考情報
・https://facebookexperimental.github.io/Robyn/
・データ活用のための数理モデリング入門
・Robyn Open Source MMM Users
・Facebook Project Robyn Open Source MMM 2021 Community Summit
・https://facebookexperimental.github.io/Robyn/docs/quick-start/
