はじめに
stanは意思決定のための分析などでのパラメータ推定に使うことが多く、機械学習のために扱うことはありませんでした。ただ、過去にリク面などでお話したデータサイエンティストの方はstanで機械学習していて、クロスバリデーションもしているとの発言をされていました。
先日、記事を漁っていたらstanでクロスバリデーションを行うためのコードを書いている方を見つけたので、その方のコードをもとに大人のirisであるwineデータを用いて、質の高いワインかどうかを分類するために階層ベイズでのロジスティック回帰モデルを回してみたいと思います。
データについて
UCI Machine Learning Repositoryにある、赤ワインの評価と成分のデータです。データに関する説明はワインの味(美味しさのグレード)は予測できるか?(1)で丁寧になされていますので、ご確認ください。今回は6点以上であれば1を、そうでなければ0を取るものを教師データとしています。
分析方針
今回は階層ベイズモデルを扱うことから、グループごとにロジスティック回帰のパラメータが異なるという仮定を置きます。そのために、citric.acidというデータを3つのカテゴリデータに変換して、それをグループとして扱います。モデルでは、今回のデータセットの変数を全て回帰項として使います。もちろん、回帰用の式からはcitric.acidは除外します。
全体の80%を訓練データに、20%をテストデータとして、10foldsクロスバリデーションでのstanによる予測結果の平均AUCを評価指標とします。最後に、テストデータを用いた予測のAUCを確かめます。また、階層ベイズモデルではないモデルでの10foldsクロスバリデーションでのAUCとも比較します
分析概要
・データ整形
・訓練データとテストデータの分割
・クロスバリデーション用のデータの作成
・stanの実行
・クロスバリデーション結果の出力
・テストデータでの予測
・非階層モデルとの比較
全体のコード以下のリンクにあります。
kick_logistic_regression_allowing_k_hold_cross_validation_hierachical.R
logistic_regression_allowing_k_fold_cross_validation_hierachical.stan
データ整形
階層ベイズで扱うグループをcitric.acidから作っています。
|
1 2 3 4 5 6 7 8 9 10 11 12 13 14 15 16 17 18 19 20 |
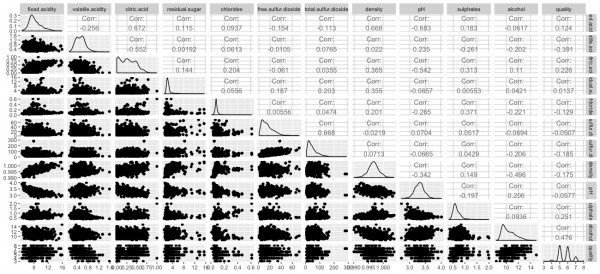
library(tidyverse) library(rstan) library(GGally) library(shinystan) library(pbmcapply) rstan_options(auto_write = TRUE) options(mc.cores = parallel::detectCores()) wine_dataset <- read.csv("dataset/winequality-red.csv") # Visualization ----------------------------------------------------------- ggpairs(wine_dataset) # Making group ----------------------------------------------------------- wine_dataset <- wine_dataset %>% mutate(citric_acid_group = if_else(citric.acid < 0.2, 1, if_else(citric.acid < 0.4, 2, 3))) wine_dataset <- wine_dataset %>% select(-citric.acid) |
訓練データとテストデータの分割
ワインの質に関するバイナリーデータをこちらで作成し、80%を訓練データに、20%をテストデータに分割しています。
|
1 2 3 4 5 6 7 8 9 10 11 12 13 14 15 16 17 18 19 20 21 22 23 24 25 26 27 |
# Split Train and Test ---------------------------------------------------- smp_size <- floor(0.8 * nrow(wine_dataset)) ## set the seed to make your partition reproducible set.seed(123) train_ind <- sample(seq_len(nrow(wine_dataset)), size = smp_size) train <- wine_dataset[train_ind, ] test <- wine_dataset[-train_ind, ] y <- if_else(wine_dataset$quality > 5, 1, 0) x <- as.matrix(wine_dataset %>% select(-quality)) y_train <- y[train_ind] y_test <- y[-train_ind] x_train <- x[train_ind,] x_test <- x[-train_ind,] x_train_group <- x_train[,ncol(x_train)] x_test_group <- x_test[,ncol(x_test)] x_train <- x_train[,1:(ncol(x_train)-1)] x_test <- x_test[,1:(ncol(x_test)-1)] x_train <- scale(x_train) x_test <- scale(x_test) |
クロスバリデーション用のデータの作成
こちらのコードでは任意の数でクロスバリデーション用のデータを作成し、stanで扱う訓練用データのlistに追加しています。
また、参考にしているブログより転用したstan_kfoldという関数を定義しています。k分割した際のstanの推定結果をリストに格納するための関数です。
|
1 2 3 4 5 6 7 8 9 10 11 12 13 14 15 16 17 18 19 20 21 22 23 24 25 26 27 28 29 30 31 32 33 34 35 36 37 38 39 40 41 42 43 44 45 46 47 48 49 50 51 52 53 54 55 56 57 |
N <- length(y_train) # sample size n_fold <- 10 # number of folds K <- ncol(x_train) #n umber of predictors # Create cross validation data -------------------------------------------- # create 10 folds of data hh <- kfold_split_random(n_fold, N) #hh index the fold ID of each data point holdout_k <- matrix(0, nrow = N, ncol = n_fold) for(i in 1:N) holdout_k[i, hh[i]] <- 1 # turn into a list holdout_k <- split(holdout_k,rep(1:ncol(holdout_k),each=nrow(holdout_k))) # the basic data object data_m <- list(N=N, K=K, M = length(unique(x_train_group)), citric_acid_group = x_train_group, X=x_train, y=y_train ) # create a list of data list data_l <- rep(list(data_m),n_fold) # add the holdout index to it for(i in 1:n_fold) data_l[[i]]$holdout <- holdout_k[[i]] # Define function --------------------------------------------------------- # function to parrallelize all computations # need at least two chains !!! stan_kfold <- function(file, list_of_datas, chains, cores,...){ library(pbmcapply) badRhat <- 1.1 # don't know why we need this? n_fold <- length(list_of_datas) model <- stan_model(file=file) # First parallelize all chains: sflist <- pbmclapply(1:(n_fold*chains), mc.cores = cores, function(i){ # Fold number: k <- ceiling(i / chains) s <- sampling(model, data = list_of_datas[[k]], chains = 1, chain_id = i) return(s) }) # Then merge the K * chains to create K stanfits: stanfit <- list() for(k in 1:n_fold){ inchains <- (chains*k - (chains - 1)):(chains*k) # Merge `chains` of each fold stanfit[[k]] <- sflist2stanfit(sflist[inchains]) } return(stanfit) } |
stanの実行
こちらのstanのコードでは、M個のグループごとにパラメータが異なるというモデルを書いています。modelブロックの途中でholdoutを入れることで一部のデータを推定に使わないようにしています。
|
1 2 3 4 5 6 7 8 9 10 11 12 13 14 15 16 17 18 19 20 21 22 23 24 25 26 27 28 29 30 31 |
data { int<lower=0> N; // number of data items int<lower=0> K; // number of predictors int<lower=0> M; // number of group row_vector[K] X[N]; int<lower=0,upper=1> y[N]; int<lower=0,upper=M> citric_acid_group[N]; int<lower=0, upper=1> holdout[N]; // index whether the observation should be held out (1) or used (0) } parameters { real mu[K]; real<lower=0> sigma[K]; vector[K] beta[M]; } model { for (k in 1:K) { mu[k] ~ normal(0, 100); sigma[k] ~ inv_gamma(1, 1); for (m in 1:M) beta[m,k] ~ normal(mu[k], sigma[k]); } for (n in 1:N){ if(holdout[n] == 0){ target += bernoulli_lpmf( y[n] | inv_logit(X[n] * beta[citric_acid_group[n]])); } } } |
こちらはstanをキックするためのコードです。いつもと違い、先程定義したstan_kfoldを用いています。
|
1 2 3 4 5 6 |
# Kick the stan code ------------------------------------------------------ # run the functions ss <- stan_kfold(file="model/logistic_regression_allowing_k_fold_cross_validation_hierachical.stan", data_l, chains=4, cores=2) |
クロスバリデーション結果の出力
以下は、k個ずつ手に入ったクロスバリデーションでの推定結果から、各パラメータの平均値を計算し、ロジスティック回帰モデルで2値の予測を行い、平均AUCを計算するコードです。
|
1 2 3 4 5 6 7 8 9 10 11 12 13 14 15 16 17 18 19 20 21 22 23 24 25 |
# Calculate Mean AUC ------------------------------------------------------ ## hierachical model set.seed(123) cv_mean_auc <- NULL for (i in 1:n_fold){ ext_fit <- extract(ss[[i]]) # choose 1 chunk # グループによって推定したパラメータが違う coef_list <- NULL group_list <- data_l[[i]]$citric_acid_group[data_l[[i]]$holdout > 0] for(j in 1:length(group_list)){ coef_list <- rbind(coef_list, colMeans(ext_fit$beta[,group_list[j],])) } lin_comb <- rowSums(data_l[[i]]$X[data_l[[i]]$holdout > 0, ] * coef_list) prob <- 1/(1 + exp(-lin_comb)) pred_value <- rbinom(sum(data_l[[i]]$holdout), 1, prob) # Syntax (response, predictor): auc = pROC::auc(data_l[[i]]$y[data_l[[i]]$holdout > 0], pred_value)[1] cv_mean_auc <- append(cv_mean_auc, auc) } cv_mean_auc mean(cv_mean_auc) |
平均AUCは0.675となりました。すごくいいわけではないですが、手抜きモデルとしてはまずまずと言ったところでしょうか。
テストデータでの予測
以下のコードで最初に分けていたテストデータでの予測結果を返します。
|
1 2 3 4 5 6 7 8 9 10 11 12 13 14 15 16 17 18 19 20 |
# Prediction -------------------------------------------------------------- # Choose best model in cross-validation ext_fit <- extract(ss[[1]]) # choose 1 chunk # グループによって推定したパラメータが違う beta_post <- NULL group_list <- x_test_group for(j in 1:length(group_list)){ beta_post <- rbind(beta_post, colMeans(ext_fit$beta[,group_list[j],])) } lin_comb <- rowSums(x_test * beta_post) prob <- 1/(1 + exp(-lin_comb)) pred_value <- rbinom(nrow(x_test), 1, prob) # Syntax (response, predictor): auc = pROC::auc(y_test, pred_value)[1] auc |
実行の結果、AUCは0.665と、クロスバリデーションでの平均AUCと比べてあまり下がりませんでした。
非階層モデルとの比較
非階層モデルでも同様に10foldsクロスバリデーションの平均AUCを計算しました。非階層モデルよりもAUCが1%ポイントくらいは高いようです。
|
1 2 3 4 5 |
> mean(cv_mean_auc) [1] 0.6745282 > mean(cv_mean_auc_normal) [1] 0.6640103 |
おわりに
現時点において、stanでの柔軟なモデリングを機械学習に活かす作法について紹介されている文献はあまりなく、選手人口はどれくらいいるのか気になるところですが、発見したブログのやり方でクロスバリデーションをカジュアルに行えるので、より多くの方がstanでの機械学習にチャレンジしうるものだなと思いました。ただ、このレベルの階層ベイズだとrstanarmで簡単にできてしまうので、より深く分析してモデルをカスタムしていきたいですね。
参考情報
[1]Lionel Hertzog (2018), “K-fold cross-validation in Stan,datascienceplus.com”
[2]Alex Pavlakis (2018), “Making Predictions from Stan models in R”, Medium
[3]Richard McElreath (2016), “Statistical Rethinking: A Bayesian Course with Examples in R and Stan (Chapman & Hall/CRC Texts in Statistical Science)”, Chapman and Hall/CRC
[4]松浦 健太郎 (2016), 『StanとRでベイズ統計モデリング (Wonderful R)』, 共立出版
[5]馬場真哉 (2019), 『実践Data Scienceシリーズ RとStanではじめる ベイズ統計モデリングによるデータ分析入門』, 講談社
