はじめに
正月は帰省もせずに暇だったので、普段の業務ではほとんど扱わない画像関連でブログを書いてみようと思います。
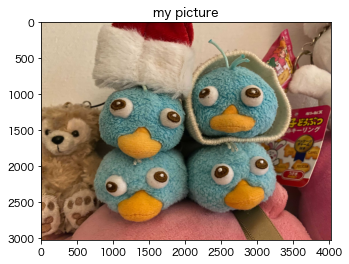
まず、よくありそうなOpenCVの適用や、DNNを用いた画像分類などを行います。扱う画像は当然、かものはしペリーのぬいぐるみです。ブログのタイトルやドメイン名になっている通り、私はかものはしペリーの愛好家です。
この記事の読者層は私で、いつか仕事で使うのをイメージして備忘録として残す感じです。
説明があまりありませんが、気分次第で追記するかもしれません。あしからず。
OpenCVで行うあれやこれや
インストールする
|
1 |
pip install opencv-python |
これで入ります。
画像を読み込んでRGBにする
|
1 2 3 4 5 6 7 8 9 |
import cv2 as cv from matplotlib import pyplot as plt dat = cv.imread("perrys.jpg") rgb = cv.cvtColor(dat, cv.COLOR_BGR2RGB) plt.imshow(rgb) plt.title('my picture') plt.show() |
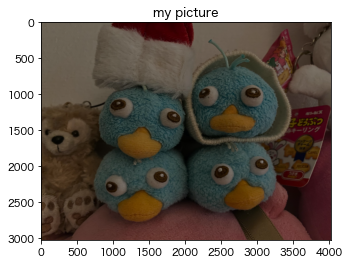
明度値の書き換え
|
1 2 3 4 5 6 7 8 9 10 11 12 13 14 15 16 |
import cv2 as cv from matplotlib import pyplot as plt dat = cv.imread("perrys.jpg") rgb = cv.cvtColor(dat, cv.COLOR_BGR2RGB) # 明度値の書き換え height, width, channel = rgb.shape for y in range(height): for x in range(width): for ch in range(channel): rgb[y][x][ch] /= 2 plt.imshow(rgb) plt.title('my picture') plt.show() |
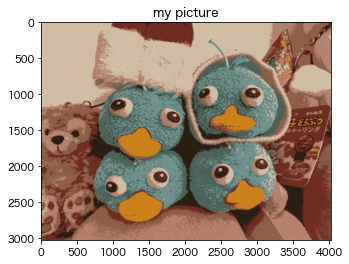
量子化
|
1 2 3 4 5 6 7 8 9 10 11 12 13 14 15 16 17 18 19 20 21 22 23 24 25 |
import cv2 as cv import numpy as np from matplotlib import pyplot as plt img = cv.imread("perrys.jpg") img = cv.cvtColor(img, cv.COLOR_BGR2RGB) Z = img.reshape((-1, 3)) # convert to np.float32 Z = np.float32(Z) # define criteria, number of clusters(K) and apply kmeans() criteria = (cv.TERM_CRITERIA_EPS + cv.TERM_CRITERIA_MAX_ITER, 10, 1.0) K = 8 ret, label, center = cv.kmeans(Z, K, None, criteria, 10, cv.KMEANS_RANDOM_CENTERS) # Now convert back into uint8, and make original image center = np.uint8(center) res = center[label.flatten()] res2 = res.reshape((img.shape)) plt.imshow(res2) plt.title('my picture') plt.show() |
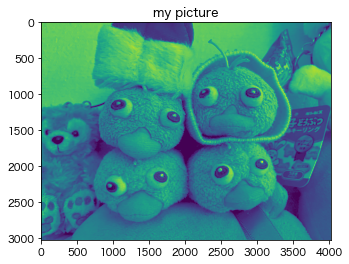
グレースケール
|
1 2 3 4 5 6 7 8 9 10 11 12 13 14 15 16 17 18 19 |
import cv2 as cv import numpy as np from matplotlib import pyplot as plt gamma22LUT = np.array([pow(x/255.0, 2.2)*255 for x in range(256)], dtype='uint8') gamma045LUT = np.array([pow(x/255.0, 1.0/2.2)*255 for x in range(256)], dtype='uint8') img = cv.imread("perrys.jpg") img = cv.cvtColor(img, cv.COLOR_BGR2RGB) # sRGB => linear (approximate value 2.2) img_bgrL = cv.LUT(img, gamma22LUT) img_grayL = cv.cvtColor(img_bgrL, cv.COLOR_BGR2GRAY) # linear => sRGB img_gray = cv.LUT(img_grayL, gamma045LUT) plt.imshow(img_gray) plt.title('my picture') plt.show() |
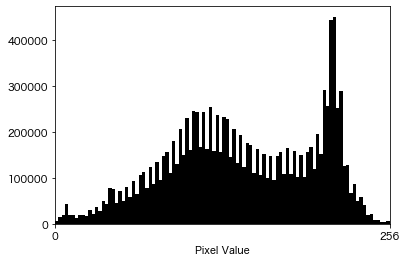
画像ヒストグラム
|
1 2 3 4 5 6 7 8 9 10 11 12 13 14 15 16 17 18 19 20 21 22 23 24 25 26 27 28 29 30 31 32 |
import cv2 as cv import numpy as np from matplotlib import pyplot as plt # 描画 def plot_hist(bins, hist, color): centers = (bins[:-1] + bins[1:]) / 2 widths = np.diff(bins) ax.bar(centers, hist, width=widths, color=color) img = cv.imread("perrys.jpg") img = cv.cvtColor(img, cv.COLOR_BGR2RGB) # 画像をグレースケール形式で読み込む。 img = cv.cvtColor(img, cv.IMREAD_GRAYSCALE) # 1次元ヒストグラムを作成する。 CH = [0] BINS = 100 # ピンの数 HIST_RANGE = [0, 256] # 集計範囲 hist = cv.calcHist([img], CH, mask=None, histSize=[BINS], ranges=HIST_RANGE) hist = hist.squeeze(axis=-1) # (n_bins, 1) -> (n_bins,) bins = np.linspace(*HIST_RANGE, BINS + 1) fig, ax = plt.subplots() ax.set_xticks([0, 256]) ax.set_xlim([0, 256]) ax.set_xlabel("Pixel Value") plot_hist(bins, hist, color="k") plt.show() |
|
1 2 3 4 5 6 7 8 9 10 11 12 13 14 15 16 17 18 19 20 21 22 23 24 25 26 27 |
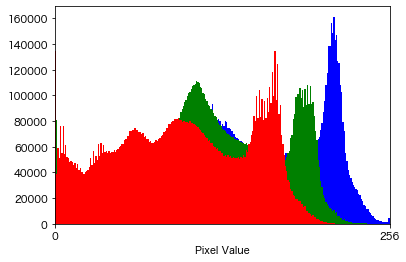
# 画像を読み込む。 img = cv.imread("perrys.jpg") img = cv.cvtColor(img, cv.COLOR_BGR2RGB) # ヒストグラムを作成する。 BINS = 256 # ビンの数 HIST_RANGE = [0, 256] # 集計範囲 hists = [] channels = {0: "blue", 1: "green", 2: "red"} for ch in channels: hist = cv.calcHist([img], channels=[ch], mask=None, histSize=[BINS], ranges=HIST_RANGE) hist = hist.squeeze(axis=-1) hists.append(hist) bins = np.linspace(*HIST_RANGE, BINS + 1) fig, ax = plt.subplots() ax.set_xticks([0, 256]) ax.set_xlim([0, 256]) ax.set_xlabel("Pixel Value") for hist, color in zip(hists, channels.values()): plot_hist(bins, hist, color=color) plt.show() |
HSV変換について
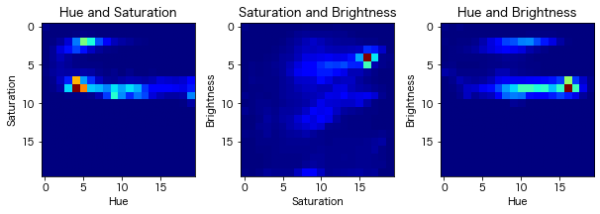
・Hue:色の種類(例えば赤、青、黄色)
・Saturation:色の鮮やかさ。色の彩度の低下につれて、灰色さが顕著になり、くすんだ色が現れる。
・Brightness:色の明るさ。
|
1 2 3 4 5 6 7 8 9 10 11 12 13 14 15 16 17 18 19 20 21 22 23 24 25 26 27 28 29 30 31 32 33 34 35 36 37 38 39 40 41 42 43 44 |
import cv2 as cv from matplotlib import pyplot as plt # 画像を読み込む。 img = cv.imread("perrys.jpg") img = cv.cvtColor(img, cv.COLOR_BGR2RGBA) # HSVに変換する(Hue色相、Saturation彩度、Value明度の三つの成分からなる色空間) hsv = cv.cvtColor(img, cv.COLOR_BGR2HSV) # 2次元ヒストグラムを作成する。 hist_range1 = [0, 256] hist_range2 = [0, 256] hist_range1.extend(hist_range2) n_bins1, n_bins2 = 20, 20 hists = [] channel_pairs = [[0, 1], [1, 2], [0, 2]] for pair in channel_pairs: hist = cv.calcHist([hsv], channels=pair, mask=None, histSize=[n_bins1, n_bins2], ranges=hist_range1) hists.append(hist) # 描画する ch_names = {0: "Hue", 1: "Saturation", 2: "Brightness"} fig = plt.figure(figsize=(10, 10 / 3)) for i, (hist, ch) in enumerate(zip(hists, channels), 1): xlabel, ylabel = ch_names[channel_pairs[i-1][0]], \ ch_names[channel_pairs[i-1][1]] ax = fig.add_subplot(1, 3, i) fig.subplots_adjust(wspace=0.3) ax.imshow(hist, cmap="jet") # 2Dヒストグラムを描画する ax.set_title(f"{xlabel} and {ylabel}") ax.set_xlabel(xlabel) ax.set_ylabel(ylabel) plt.show() |
明度変換
|
1 2 3 4 5 6 7 8 9 10 11 12 13 |
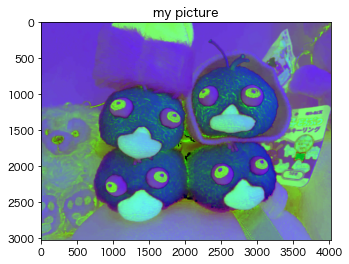
import cv2 as cv from matplotlib import pyplot as plt # 画像を読み込む。 img = cv.imread("perrys.jpg") img = cv.cvtColor(img, cv.COLOR_BGR2RGB) # HSVに変換する(Hue色相、Saturation彩度、Value明度の三つの成分からなる色空間) hsv = cv.cvtColor(img, cv.COLOR_BGR2HSV) plt.imshow(hsv) plt.title('my picture') plt.show() |
フィルタ処理
|
1 2 3 4 5 6 7 8 9 10 11 12 13 14 15 16 17 |
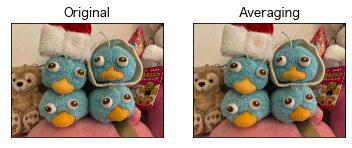
import cv2 as cv import numpy as np from matplotlib import pyplot as plt # 2D Convolution (画像のフィルタリング) # 画像を読み込む。 img = cv.imread("perrys.jpg") img = cv.cvtColor(img, cv.COLOR_BGR2RGB) kernel = np.ones((5, 5), np.float32) / 25 dst = cv.filter2D(img, -1, kernel) plt.subplot(121), plt.imshow(img), plt.title('Original') plt.xticks([]), plt.yticks([]) plt.subplot(122), plt.imshow(dst), plt.title('Averaging') plt.xticks([]), plt.yticks([]) plt.show() |
|
1 2 3 4 5 6 7 8 9 10 11 12 13 14 15 16 |
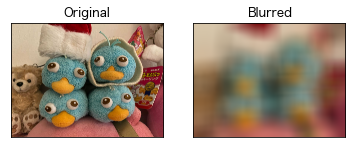
import cv2 as cv import numpy as np from matplotlib import pyplot as plt # 画像のぼかし (平滑化) # 画像を読み込む。 img = cv.imread("perrys.jpg") img = cv.cvtColor(img, cv.COLOR_BGR2RGBA) blur = cv.blur(img, (500, 500)) plt.subplot(121), plt.imshow(img), plt.title('Original') plt.xticks([]), plt.yticks([]) plt.subplot(122), plt.imshow(blur), plt.title('Blurred') plt.xticks([]), plt.yticks([]) plt.show() |
|
1 2 3 4 5 6 7 8 9 10 11 12 13 14 15 16 |
import cv2 as cv import numpy as np from matplotlib import pyplot as plt # ガウシアンフィルタ # 画像を読み込む。 img = cv.imread("perrys.jpg") img = cv.cvtColor(img, cv.COLOR_BGR2RGBA) blur = cv.GaussianBlur(src=img, ksize=(251, 251), sigmaX=0) plt.subplot(121), plt.imshow(img), plt.title('Original') plt.xticks([]), plt.yticks([]) plt.subplot(122), plt.imshow(blur), plt.title('ガウシアンフィルタ') plt.xticks([]), plt.yticks([]) plt.show() |

特徴点検出
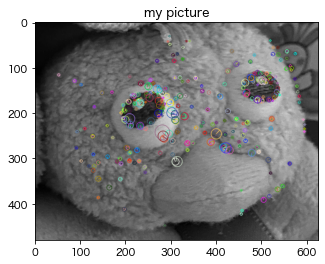
画像の中から特徴的なポイントを抽出するアルゴリズム。
|
1 2 3 4 5 6 7 8 9 10 11 12 13 14 15 16 17 18 19 20 21 22 23 |
import cv2 as cv import numpy as np from matplotlib import pyplot as plt # 画像を読み込む。 img = cv.imread("perry_part.png") img = cv.cvtColor(img, cv.COLOR_BGR2RGBA) # グレースケール変換 from_img = cv.cvtColor(img, cv.COLOR_RGB2GRAY) # 特徴点抽出(AKAZE) akaze = cv.AKAZE_create() from_key_points, from_descriptions = akaze.detectAndCompute(from_img, None) # キーポイントの表示 extracted_img = cv.drawKeypoints(image=from_img, keypoints=from_key_points, outImage=None, flags=4 ) plt.imshow(extracted_img) plt.title('my picture') plt.show() |
マッチング
|
1 2 3 4 5 6 7 8 9 10 11 12 13 14 15 16 17 18 19 20 21 22 23 24 25 |
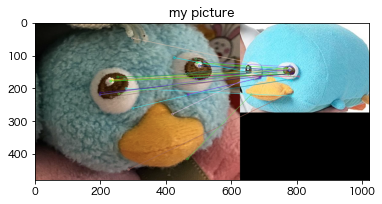
import cv2 as cv import numpy as np from matplotlib import pyplot as plt # 2枚の画像の特徴点を対応付ける def match(from_img, to_img): ''' マッチング ''' # 各画像の特徴点を取る from_key_points, from_descriptions = akaze.detectAndCompute(from_img, None) to_key_points, to_descriptions = akaze.detectAndCompute(to_img, None) # 2つの特徴点をマッチさせる bf_matcher = cv.BFMatcher_create(cv.NORM_HAMMING, True) matches = bf_matcher.match(from_descriptions, to_descriptions) # 特徴点同士をつなぐ match_img = cv.drawMatches( from_img, from_key_points, to_img, to_key_points, matches, None, flags=2 ) return match_img, (from_key_points, from_descriptions, to_key_points, to_descriptions, matches) |
|
1 2 3 4 5 6 7 8 9 10 |
# 画像を読み込む。 img_1 = cv.imread("perry_part.png") img_1 = cv.cvtColor(img_1, cv.COLOR_BGR2RGB) img_2 = cv.imread("images/perry_w6.jpeg") img_2 = cv.cvtColor(img_2, cv.COLOR_BGR2RGB) plt.imshow(match(img_1, img_2)[0]) plt.title('my picture') plt.show() |
特徴量抽出
・BFMatcher:Brute-Force matcher(総当たりで特徴点を比較している。類似度は数値が低いほど類似しているとみなす。)
・AKAZE:日本語の『風』から命名された手法。二つの画像のキーポイントを発見するために使われる。変化への耐性が強いとされる。非線形拡散方程式を近似的に解いて、非線形スケール空間の特徴量を検出している。
|
1 2 3 4 5 6 7 8 9 10 11 12 13 14 15 16 17 18 19 20 21 22 23 24 25 26 27 28 29 |
def calc_similarity(target_img_1_path, comparing_img_2_path, IMG_SIZE): target_img_1 = cv.imread(target_img_1_path) comparing_img_2 = cv.imread(comparing_img_2_path) target_img_1 = cv.cvtColor(target_img_1, cv.COLOR_BGR2RGB) comparing_img_2 = cv.cvtColor(comparing_img_2, cv.COLOR_BGR2RGB) # グレースケールで読み出し target_gray1 = cv.cvtColor(target_img_1, cv.IMREAD_GRAYSCALE) comparing_gray2 = cv.cvtColor(comparing_img_2, cv.COLOR_BGR2GRAY) # 200px×200pxに変換 target_gray1 = cv.resize(target_gray1, IMG_SIZE) comparing_gray2 = cv.resize(comparing_gray2, IMG_SIZE) # BFMatcherオブジェクトの生成 bf = cv.BFMatcher(cv.NORM_HAMMING) # AKAZE検出器の生成 detector = cv.AKAZE_create() (target_kp, target_des) = detector.detectAndCompute(target_gray1, None) (comparing_kp, comparing_des) = detector.detectAndCompute(comparing_gray2, None) matches = bf.match(target_des, comparing_des) #特徴量の距離を出し、平均を取る dist = [m.distance for m in matches] ret = sum(dist) / len(dist) return ret |
|
1 2 3 4 5 6 7 8 9 10 11 12 13 14 15 16 17 18 19 20 |
import cv2 as cv import os TARGET_FILE = "perry_part.png" IMG_DIR = os.path.abspath(os.path.dirname("")) + '/images/' IMG_SIZE = (200, 200) files = os.listdir(IMG_DIR) file_list = ["images/"+ i for i in files] for _ in file_list: print(_) print(calc_similarity(target_img_1_path=TARGET_FILE, comparing_img_2_path=_, IMG_SIZE=IMG_SIZE)) each_img = cv.imread(_) each_img = cv.cvtColor(each_img, cv.COLOR_BGR2RGBA) plt.imshow(each_img) plt.title('my picture') plt.show() |
これがベースとなるペリーの画像。
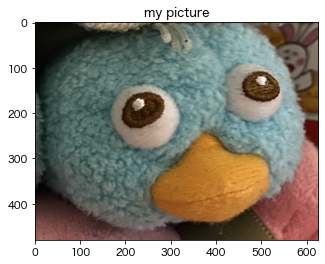
以下では、このペリーとの類似度を計算している。
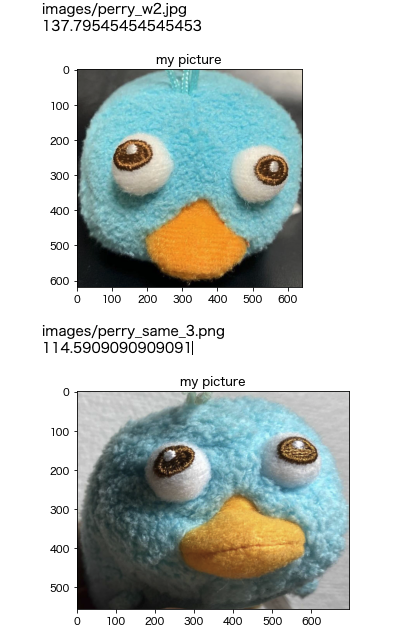
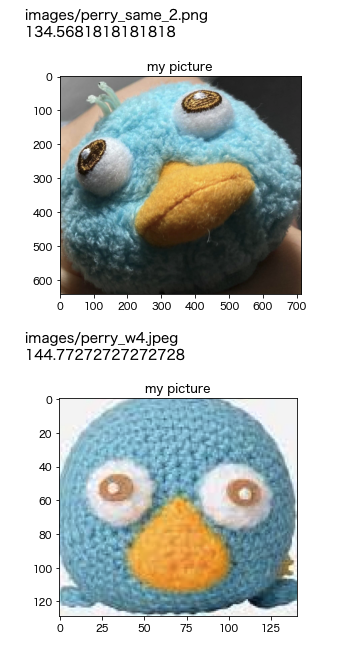
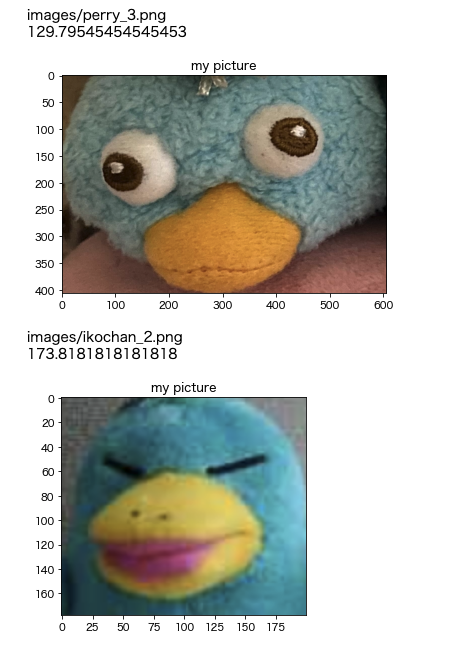
画像分類
ペリーとイコちゃんの画像からペリーかどうか判定したい。
今回はペリーの画像27枚、イコちゃんの画像20枚を用意しました。
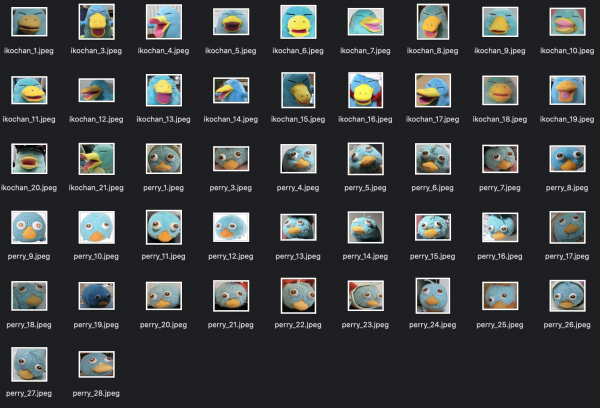
今回はKerasにある、VGG16というモデルを使って分類を行います。ハイパーパラメータはAdamです。reluとかドロップアウト層とかは参考文献のまんまを使っています。
|
1 2 3 4 5 6 7 8 9 10 11 12 13 14 15 16 17 18 19 20 21 22 23 24 25 26 27 28 29 30 31 32 33 34 35 36 37 38 |
from keras.applications.vgg16 import VGG16 # from keras.optimizers import Adam # こっちならいけた from tensorflow.keras.optimizers import Adam from keras.layers import Activation, Dense, Dropout, Flatten, Input from keras.models import Model def model_vgg(class_num,height,width): out_num = class_num input_tensor = Input(shape=(height, width, 3)) vgg = VGG16(include_top=False, input_tensor=input_tensor, weights=None) x = vgg.output x = Flatten()(x) x = Dense(2048,activation="relu")(x) x = Dropout(0.5)(x) x = Dense(2048,activation="relu")(x) x = Dropout(0.5)(x) x = Dense(out_num)(x) x = Activation("softmax")(x) model = Model(inputs=vgg.inputs,outputs=x) model.compile(optimizer=Adam(lr=1e-4), loss='categorical_crossentropy', metrics=['accuracy']) return model from PIL import Image import numpy as np from keras.utils import np_utils # paramaters ------------------- WIDTH = 256 HEIGHT = 256 epochs = 15 batch_size = 32 class_num = 2 |
ファイルの読み込みです。
trainというディレクトリにperry_とかikochan_とかからなる画像ファイルがある想定です。
|
1 2 3 4 5 6 7 8 |
from os import listdir from os.path import isfile, join mypath = "train/" onlyfiles = [f for f in listdir(mypath) if isfile(join(mypath, f))] perry_list = [ _ for _ in onlyfiles if 'perry_' in _] ikochan_list = [ _ for _ in onlyfiles if 'ikochan_' in _] |
画像からの学習用のデータの作成。
|
1 2 3 4 5 6 7 8 9 10 11 12 13 14 15 16 17 18 19 20 21 22 23 24 25 26 27 28 29 30 |
X_train = [] Y_train = [] for img_path in perry_list: img = Image.open(mypath+img_path) img_resize = img.resize((WIDTH,HEIGHT)) img_flip = ImageOps.flip(img_resize) img_mirror = ImageOps.mirror(img_resize) img_mirror_flip = ImageOps.flip(img_mirror) X_train.extend([np.array(img_resize), np.array(img_flip), np.array(img_mirror), np.array(img_mirror_flip)]) # ペリーにはラベル0を与える Y_train.extend([[0], [0], [0], [0]]) for img_path in ikochan_list: img = Image.open(mypath+img_path) img_resize = img.resize((WIDTH,HEIGHT)) img_flip = ImageOps.flip(img_resize) img_mirror = ImageOps.mirror(img_resize) img_mirror_flip = ImageOps.flip(img_mirror) X_train.extend([np.array(img_resize), np.array(img_flip), np.array(img_mirror), np.array(img_mirror_flip)]) # いこちゃんにはラベル1を与える Y_train.extend([[1], [1], [1], [1]]) |
学習の実行。
|
1 2 3 4 5 6 7 8 9 10 11 12 13 14 15 16 17 18 19 |
# 画素値0~255を0~1の間に標準化する X_train = np.asarray(X_train) / 255. Y_train = np.asarray(Y_train) # ラベルをone-hotなベクトルに変換する Y_train = np_utils.to_categorical(Y_train, class_num) # modelを読み込む model = model_vgg(class_num, HEIGHT, WIDTH) # 学習する history = model.fit( np.asarray(X_train).astype(np.int), np.asarray(Y_train).astype(np.int), batch_size=batch_size, epochs=epochs, verbose=1, shuffle=True ) |
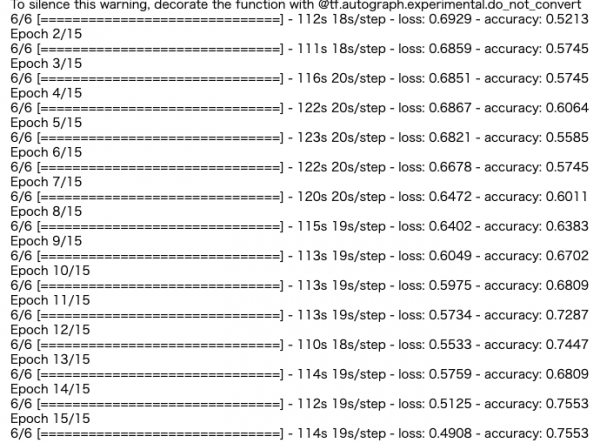
テストデータにモデルを当てはめて推論し、精度をみます。今回はテストデータとして別に、ペリー9枚、イコちゃん7枚の計16枚の画像を用意しました。
果たしてペリーとイコちゃんを識別することはできるのでしょうか。

|
1 2 3 4 5 6 7 8 9 10 11 12 13 14 15 16 17 18 19 20 21 22 23 24 25 26 27 28 29 30 31 32 33 34 35 36 37 38 39 40 41 42 43 44 45 |
# 学習済みの重みを保存する model.save_weights("weights%d_%d.h5"%(class_num, epochs)) mypath_test = "test/" onlyfiles_test = [f for f in listdir(mypath_test) if isfile(join(mypath_test, f))] test_list = [ _ for _ in onlyfiles_test if '.jpeg' in _] X_test = [] for img_path in test_list: img = Image.open(mypath_test+img_path) img_resize = img.resize((WIDTH,HEIGHT)) img_array = np.array(img_resize) X_test.append(img_array) # 画素値0~255を0~1の間に標準化する X_test = np.asarray(X_test) / 255. # modelの呼び出し model = model_vgg(class_num, HEIGHT, WIDTH) # 学習済みの重みのロード model.load_weights("weights2_15.h5") Yp = model.predict(np.asarray(X_test).astype(np.int)) average_score = np.mean([ _[1] for _ in Yp ]) # 予測スコアの平均値以上の場合、いこちゃんと判定したとみなす predicted_flag = [ 1 if _[1] >= average_score else 0 for _ in Yp ] actual_flag = [ 1 if 'ikochan_' in _ else 0 for _ in test_list ] # Accuracy from operator import eq res = sum(map(eq, predicted_flag, actual_flag)) Accuracy =res / len(actual_flag) # Recall Recall = np.dot(predicted_flag, actual_flag, out = None) / sum(actual_flag) # Precision Precision = np.dot(predicted_flag, actual_flag, out = None) / sum(predicted_flag) # F1 F1 = 2 * Precision * Recall / (Precision + Recall) |
・Accuracy:0.688
・Recall:0.857
・Precision:0.6
・F1:0.705
どうなんでしょう。まずまずなんでしょうか。
間違えたやつがどれか確認
|
1 2 3 4 5 6 7 8 9 10 11 12 13 14 15 16 17 18 19 20 21 22 23 24 |
# 間違えた要素の番号を知りたい miss_match_list = [] predicted_flag_list = [] for i , (_, __) in enumerate(zip(predicted_flag, actual_flag)): if _ != __: miss_match_list.append(test_list[i]) predicted_flag_list.append(predicted_flag[i]) import pandas as pd miss_match_df = pd.DataFrame(data={'file_name': miss_match_list, 'predicted_flag': predicted_flag_list}) import matplotlib.pyplot as plt from PIL import Image fig,ax = plt.subplots(2, 3) file_names = [ mypath_test + _ for _ in miss_match_df.file_name.tolist()] for i in range(len(file_names)): with open(file_names[i],'rb') as f: image=Image.open(f) ax[i%2][i//2].imshow(image) fig.show() |
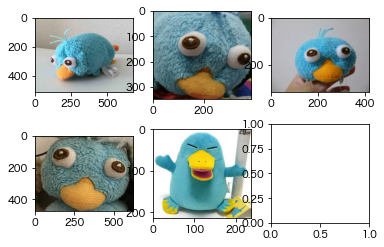
仕事で使う機会があるようなないような画像の世界ですが、計算資源が大事だなと思いますね。
参考情報
テキスト・画像・音声データ分析 (データサイエンス入門シリーズ)
Display OpenCV Image in Jupyter Notebook.py
Python でグレースケール(grayscale)化
OpenCV で画像のヒストグラムを作成する方法
HSV色空間
色空間の変換
画像フィルタリング
OpenCV: 特徴点抽出とマッチング
キーポイントとマッチの描画関数
OpenCVのAKAZEで顔写真の類似度判定をやってみた
総当たりマッチングの基礎
OpenCV3でAKAZE特徴量を検出する
KAZE Features
小惑星画像の対応点決定を目的としたSIFTとAKAZEの性能比較
線形・非線形拡散方程式の差分解法と解の可視化
AI技術を魚種の画像分類に応用してみた!
ベクトルの内積や行列の積を求めるnumpy.dot関数の使い方
Python | Count of common elements in the lists
[解決!Python]リストの内包表記と「if」を組み合わせるには
Convert png to jpeg using Pillow
ValueError: Failed to convert a NumPy array to a Tensor (Unsupported object type int) in Python
Pythonで文字列のリスト(配列)の条件を満たす要素を抽出、置換
ImportError: cannot import name ‘adam’ from ‘keras.optimizers’
pandas.DataFrame
Pythonでenumerateとzipを組み合わせて同時に使う