データマイニング界隈で人気のKDnuggetsで紹介されていた、”Dealing with Unbalanced Classes, SVMs, Random Forests, and Decision Trees in Python“のプログラムが残念なことに画像だったので、写経しました。せっかくなので、紹介させていただきます。内容としては不均衡データに対する処方の紹介で、プログラムはPythonで書かれています。ライブラリさえインストールできれば皆さんもすぐに実行できるので、是非チャレンジしてみて下さい。
まずはもろもろライブラリを呼び出します。
|
1 2 3 4 5 6 7 8 9 10 |
%matplotlib inline import numpy as np import scipy as sp import pandas as pd import sklearn import seaborn as sns from matplotlib import pyplot as plt import sklearn.cross_validation |
CSV形式のデータセットをWebサイトから取得します。ワインの評価と、ワインに関した特徴量からなるデータセットです。
|
1 2 |
wine_df = pd.read_csv("https://archive.ics.uci.edu/ml/machine-learning-databases/wine-quality/winequality-red.csv", sep=";") wine_df.head() |
分類のための目的変数を作成します。
|
1 2 3 4 5 6 7 |
#ワインの質に関する数値 Y = wine_df.quality.values #質に関するデータを落としている。 wine_df = wine_df.drop('quality', axis =1) #7よりも小さかったら0、それ以外は1とする。 Y = np.asarray([1 if i>=7 else 0 for i in Y]) wine_df.head() |
|
1 |
X = wine_df.as_matrix() |
ランダムフォレストを実行します。
|
1 2 3 4 5 6 7 8 9 10 |
from sklearn.ensemble import RandomForestClassifier from sklearn.cross_validation import cross_val_score scores =[] #1~41までの木の数のランダムフォレストを実行する。 for val in range(1,41): clf = RandomForestClassifier(n_estimators =val) validated = cross_val_score(clf, X, Y, cv =10) scores.append(validated) |
どんな結果が返ってくるのか、試しに一つだけツリーの数を2にして実行してみます。10回分のクロスバリデーションを行った推定結果が出力されています。これは、いわゆる正解率のことを指します。
|
1 2 3 4 5 6 7 |
#木の数が2のランダムフォレストの結果を返す clf1 = RandomForestClassifier(n_estimators = 2) validated = cross_val_score(clf1, X, Y, cv=10) validated array([ 0.8757764 , 0.86956522, 0.8625 , 0.84375 , 0.8875 , 0.85 , 0.8375 , 0.85534591, 0.85534591, 0.88679245]) |
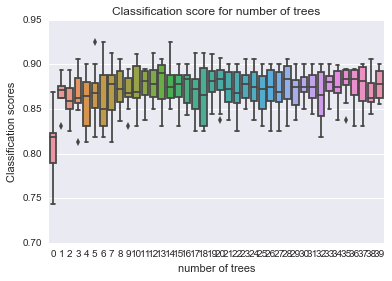
ツリーの数に応じた正解率を可視化します。
|
1 2 3 4 5 |
sns.boxplot(data=scores) plt.xlabel('number of trees') plt.ylabel('Classification scores') plt.title('Classification score for number of trees') plt.show() |
正解率はツリーの数を増やすことで増すようです。
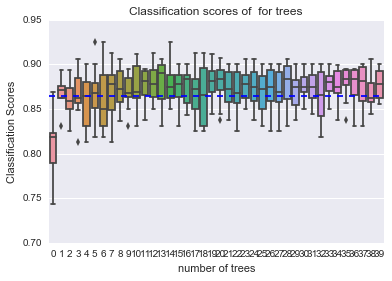
しかしながら、正解率は誤解されやすい指標です。不均衡データでは偏りのある方ばかりを当てていても、正解率は増してしまいます。当たりだけを予測できて、ハズレを予測できないというのは分類器として使いみちが限られると思います。そこで、悪いワインの割合を直線で引いてみます。
|
1 2 3 4 5 6 7 8 9 10 11 12 13 14 |
len_y = len(Y) temp = [i for i in Y if i ==0] temp_1 = temp.count(0) percentage = float(temp_1)/float(len_y) print(float(temp_1)/float(len_y)*100) sns.boxplot(data=scores) plt.axhline(y = percentage, ls = '--') plt.xlabel('number of trees') plt.ylabel('Classification Scores') plt.title('Classification scores of for trees') plt.show() |
悪いワインの割合がそもそも多いので、悪いワインと判定しまくっていても、正解率は高いわけです。
そこで、機械学習における予測精度の評価指標とされているF値を使います。
ツリーの数を増やしても、F値は良くなっていないようです。
|
1 2 3 4 5 6 |
scores = [] for val in range(1, 41): cfl = RandomForestClassifier(n_estimators = val) validated = cross_val_score(clf, X, Y, cv=10, scoring = 'f1') scores.append(validated) |
|
1 2 3 4 5 |
sns.boxplot( data=scores) plt.xlabel('number of trees') plt.ylabel('F1 Scores') plt.title('F1 scores as a function of the number of trees') plt.show() |
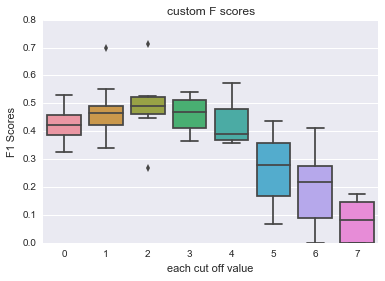
ここでは、0.5よりも大きいとする予測になる特徴量のデータを切り捨てます。その切り捨てる割合がどこが望ましいのかを以下で探していきます。
|
1 2 3 4 |
clf = RandomForestClassifier(n_estimators= 15) clf.fit(X, Y) (clf.predict_proba(X)[:,1] > 0.5).astype(int) |
|
1 2 3 4 5 6 7 8 9 10 11 12 13 14 15 16 |
def cutoff_predict(clf, X, cutoff): return (clf.predict_proba(X)[:,1] > cutoff).astype(int) scores = [] def custom_f1(cutoff): def f1_cutoff(clf, X, Y): ypred = cutoff_predict(clf, X, cutoff) return sklearn.metrics.f1_score(Y, ypred) return f1_cutoff for cutoff in np.arange(0.1, 0.9, 0.1): clf = RandomForestClassifier(n_estimators=15) validated = cross_val_score(clf, X, Y, cv=10, scoring=custom_f1(cutoff)) scores.append(validated) |
|
1 2 3 4 5 |
sns.boxplot(data=scores, names= np.arange(0.1, 0.9, 0.1)) plt.xlabel('each cut off value') plt.ylabel('F1 Scores') plt.title('custom F scores') plt.show() |
どうやら、階級値が2~4、つまり割合にして0.3~0.5のカットオフ値が望ましい水準のようです。
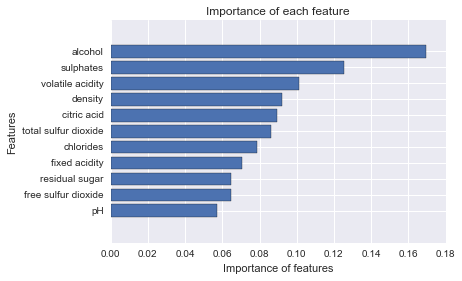
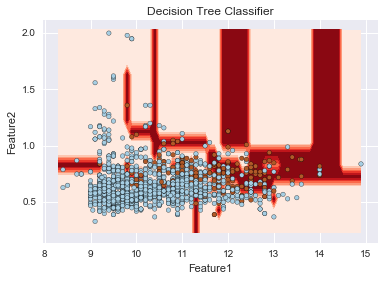
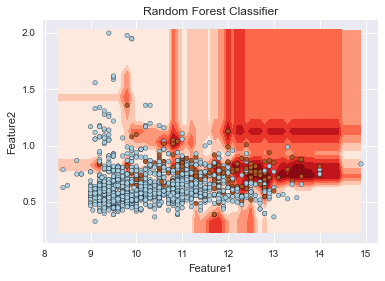
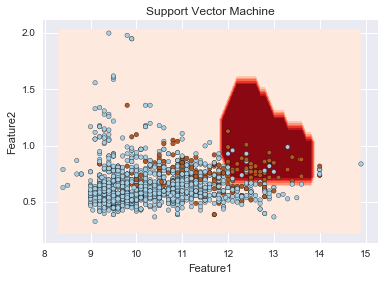
以下では、決定境界の可視化を行います。しかしながら、二次元の可視化となると、複数あるデータの中から特徴量を二つだけ選ばなければなりません。その変数を決めるに際して、変数の重要度を用います。変数の重要度はランダムフォレストで計算可能です。
|
1 2 3 4 5 6 7 8 9 10 11 12 13 14 15 |
clf = RandomForestClassifier(n_estimators=15) clf.fit(X, Y) imp = clf.feature_importances_ names = wine_df.columns imp, names = zip(*sorted(zip(imp, names))) plt.barh(range(len(names)), imp, align='center') plt.yticks(range(len(names)), names) plt.xlabel('Importance of features') plt.ylabel('Features') plt.title('Importance of each feature') plt.show() |
|
1 2 3 4 5 6 7 8 9 10 11 12 13 14 15 16 17 18 19 20 21 22 23 24 |
from sklearn.tree import DecisionTreeClassifier import sklearn.linear_model import sklearn.svm def plot_decision_surface(clf, X_train, Y_train): plot_step=0.1 if X_train.shape[1] != 2: raise ValueError("X_train should have exactly 2 columns!") x_min, x_max = X_train[:, 0].min() - plot_step, X_train[:, 0].max() + plot_step y_min, y_max = X_train[:, 1].min() - plot_step, X_train[:, 1].max() + plot_step xx, yy = np.meshgrid(np.arange(x_min, x_max, plot_step), np.arange(y_min, y_max, plot_step)) clf.fit(X_train, Y_train) if hasattr(clf, 'predict_proba'): Z = clf.predict_proba(np.c_[xx.ravel(), yy.ravel()])[:,1] else: Z = clf.predict(np.c_[xx.ravel(), yy.ravel()]) Z = Z.reshape(xx.shape) cs = plt.contourf(xx, yy, Z, cmap = plt.cm.Reds) plt.scatter(X_train[:,0], X_train[:,1], c=Y_train, cmap=plt.cm.Paired) plt.show() |
こちらで、重要度が上位のものに絞って決定境界を可視化します。ここでは、ランダムフォレストのみならず、SVMや決定木も実行されています。
|
1 2 3 4 5 6 7 8 9 10 11 12 13 14 15 |
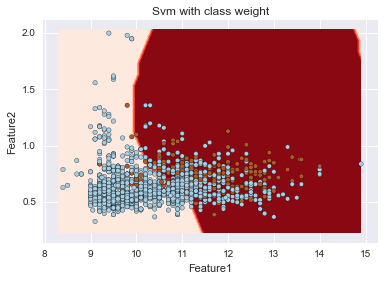
imp_fe = np.argsort(imp)[::-1][0:2] X_imp = X[:, imp_fe] algorithms = [DecisionTreeClassifier(), RandomForestClassifier(), sklearn.svm.SVC(C = 100.0, gamma = 1)] title = ['Decision Tree Classifier', 'Random Forest Classifier', 'Support Vector Maachine'] for i in xrange(3): plt.title(title[i]) plt.xlabel('Feature1') plt.ylabel('Feature2') plot_decision_surface(algorithms[i], X_imp, Y) |
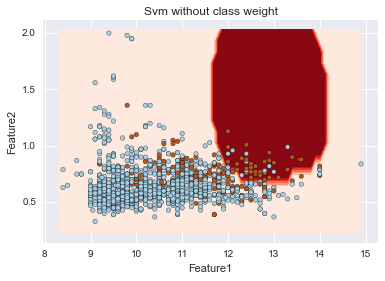
sklearnのSVMはデフォルトではクラスごとの重み付けを行わないが、自動で重み付けを行うことが出来る。以下の例では、C=1、gamma=1でクラスごとの重み付けを行う・行わないでの決定境界を描いている。重み付けを行うことで、赤色の少ない方のデータの識別が比較的できていることが伺えるが、他方で、多くの青を誤判定している。さらなる改善にはパラメータチューニングが必要となります。
|
1 2 3 4 5 6 7 8 9 10 11 |
svm = [sklearn.svm.SVC(C = 1.0, gamma = 1.0, class_weight=None), sklearn.svm.SVC(C = 1.0, gamma = 1.0, class_weight='auto')] title = ['Svm without class weight', 'Svm with class weight'] for i in xrange(2): plt.title(title[i]) plt.xlabel('Feature1') plt.ylabel('Feature2') plot_decision_surface(svm[i], X_imp, Y) |
不均衡データに対するアプローチや、Pythonによる機械学習を学ぶ良い機会になりました。KDnuggetsは非常に勉強になりますね。


