rstanを用いて、Googleトレンドデータの予測モデルを推定してみます。
ほとんど岩波データサイエンスのものですが、Googleトレンドのデータを月ごとの季節性を加味した状態空間モデルを用いて予測してみました。
今回の分析では、
・modelのstanコード(stan)
・Rでstanを動かすためのコード(R)
(・可視化のためのコード(R))←必須ではない
を用意します。
データですが、GoogleTrendのサイトで任意のキーワードで検索して、
その時系列データをCSVでダウンロードすれば手に入ります。(ちょっと見つけにくい)
データの形式はシンプルで、
先頭にY
とおいて後はトレンドの値を行ごとに置いていけばいけます。
要はN行1列データをテキストファイルに保存すればOKです。(1行目はY)
まずstanのコードですが、岩波データサイエンスのサンプルコードの季節を4から12に変えています。(たったこれだけ)
Googleトレンドのデータは月単位でも結構値がふれることがあるので、月ごとに応じた潜在的な変数が必要だと思いました。
|
1 2 3 4 5 6 7 8 9 10 11 12 13 14 15 16 17 18 19 20 21 22 23 24 25 26 27 28 29 30 31 32 33 34 35 36 37 38 39 |
data { int<lower=1> T; int<lower=1> T_next; real Y[T]; } parameters { real mu[T]; real s[T]; real<lower=0> s_mu; real<lower=0> s_s; real<lower=0> s_r; } model { for(t in 2:T) mu[t] ~ normal(mu[t-1], s_mu); for(t in 12:T) s[t] ~ normal(-s[t-1]-s[t-2]-s[t-3]-s[t-4]-s[t-5]-s[t-6]-s[t-7]-s[t-8]-s[t-9]-s[t-10]-s[t-11], s_s); for(t in 1:T) Y[t] ~ normal(mu[t]+s[t], s_r); } generated quantities { real mu_all[T+T_next]; real s_all[T+T_next]; real y_next[T_next]; for (t in 1:T){ mu_all[t] <- mu[t]; s_all[t] <- s[t]; } for (t in (T+1):(T+T_next)){ mu_all[t] <- normal_rng(mu_all[t-1], s_mu); s_all[t] <- normal_rng(-s_all[t-1]-s_all[t-2]-s_all[t-3]-s_all[t-4]-s_all[t-5]-s_all[t-6]-s_all[t-7]-s_all[t-8]-s_all[t-9]-s_all[t-10]-s_all[t-11], s_s); } for (t in 1:T_next) y_next[t] <- normal_rng(mu_all[T+t]+s_all[T+t], s_r); } |
Rでstanを動かすためのコードですが、ここはサンプルコードとほぼ一緒です。
|
1 2 3 4 5 6 7 8 9 10 11 12 13 14 |
library(rstan) setwd("任意") d <- read.csv('data-trend4.txt', header=TRUE) T <- nrow(d) T_next <- 8 data <- list(T=T, T_next=T_next, Y=d$Y) stanmodel <- stan_model(file='model_custom.stan') fit <- sampling( stanmodel, data=data, pars=c('mu_all','s_all','y_next','s_mu','s_s','s_r'), iter=10200, warmup=200, thin=10, chains=3, seed=123 ) |
可視化のためのコードについてもサンプルコードとほぼ一緒です。
|
1 2 3 4 5 6 7 8 9 10 11 12 13 14 15 16 17 18 19 20 21 22 23 24 25 26 27 28 29 30 31 32 33 34 35 36 37 38 39 40 41 42 43 44 45 46 47 48 49 |
library(ggplot2) # after estimation d_obs <- data.frame(X=1:T, Y=d$Y) p <- ggplot() p <- p + theme_bw() + theme(text=element_text(size=18)) p <- p + geom_line(data=d_obs, aes(x=X, y=Y), color='black', alpha=0.8, size=2) p <- p + labs(x='Time [month]', y='trend') p <- p + coord_cartesian(xlim=c(0.9, 152.1)) ggsave(file='fig2-top-left.png', plot=p, dpi=300, width=6, height=4) makeDataFrameQuantile <- function(x, y_smp){ qua <- apply(y_smp, 2, quantile, prob=c(0.1, 0.25, 0.5, 0.75, 0.9)) d_est <- data.frame(X=x, t(qua)) colnames(d_est) <- c('X', 'p10', 'p25', 'p50', 'p75', 'p90') return(d_est) } plotTimecourse <- function(file, d_est, d_obs){ p <- ggplot() p <- p + theme_bw() + theme(text=element_text(size=18)) p <- p + geom_vline(xintercept=T, linetype='dashed') p <- p + geom_ribbon(data=d_est, aes(x=X, ymin=p10, ymax=p90), fill='black', alpha=0.25) p <- p + geom_ribbon(data=d_est, aes(x=X, ymin=p25, ymax=p75), fill='black', alpha=0.5) p <- p + geom_line(data=d_est, aes(x=X, y=p10), color='black', size=0.2) p <- p + geom_line(data=d_est, aes(x=X, y=p90), color='black', size=0.2) p <- p + geom_line(data=d_est, aes(x=X, y=p25), color='black', size=0.2) p <- p + geom_line(data=d_est, aes(x=X, y=p75), color='black', size=0.2) p <- p + geom_line(data=d_est, aes(x=X, y=p50), color='black', size=0.4) if (!is.null(d_obs)){ p <- p + geom_line(data=d_obs, aes(x=X, y=Y), color='black', size=2, alpha=0.9) } p <- p + labs(x='month', y='trend') p <- p + coord_cartesian(xlim=c(0.9, 152.1)) ggsave(file=file, plot=p, dpi=300, width=6, height=4) } la <- rstan::extract(fit) d_est <- makeDataFrameQuantile(x=1:(T+T_next), y_smp=la$mu_all) plotTimecourse(file='fig2-bottom-left.png', d_est=d_est, d_obs=d_obs) d_est <- makeDataFrameQuantile(x=1:(T+T_next), y_smp=la$s_all) plotTimecourse(file='fig2-bottom-right.png', d_est=d_est, d_obs=NULL) d_est <- makeDataFrameQuantile(x=(T+1):(T+T_next), y_smp=la$y_next) d_est <- rbind(data.frame(X=T, p10=d$Y[T], p25=d$Y[T], p50=d$Y[T], p75=d$Y[T], p90=d$Y[T]), d_est) plotTimecourse(file='fig2-top-right.png', d_est=d_est, d_obs=d_obs) |
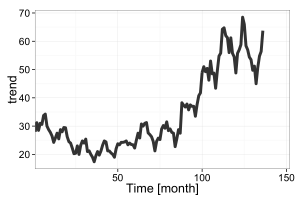
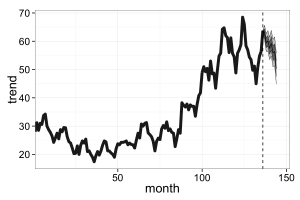
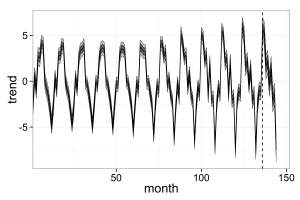
以上を実行した結果、以下のような図が出てきます。
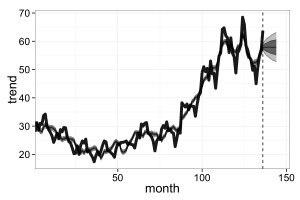
8期先までの予測範囲です。信頼区間90%までの範囲となっています。
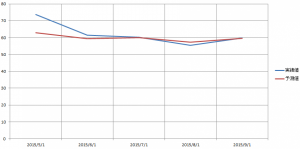
ついでに、4月までのデータを用いて、5~9月の予測を行い、その比較を行っています。
5月が大きく外れましたが、その後はある程度当てれているように見えます。
5月も当てれるようなモデルを作りたいものですね。
参考文献
